
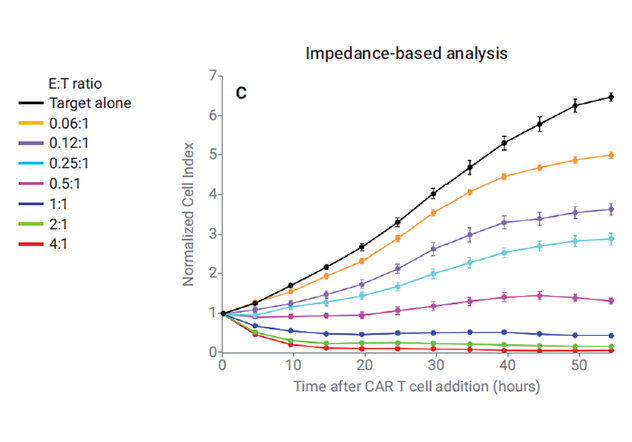
Figure 5. (Edited) Time courses for HEK-293-CD19 killing by CD19 CAR T cells as measured by impedance.
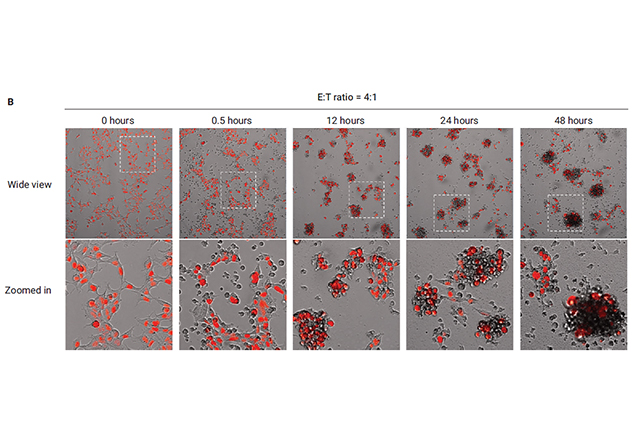
Figure 3B. Killing of RFP-expressing HEK-293-CD19 cells by CD19 CAR T cells. (A) Comparison of different E:T ratios 48 hours post CAR T-cell addition. The white squares in the upper panels denote the regions that are blown up in the lower panels. The unlabeled CAR T cells are grey. (B) Comparison of different time points for a constant E:T ratio of 4:1.
For Research Use Only. Not for use in diagnostic procedures.